As a creative technologist specializing in Data Science & Visualization, I’m interested in understanding how to represent data through visual encoding with intention — to see the story behind the numbers.
Beyond that, I bring a breadth of transferrable skills from dabbling in different areas of technology such as XR Development, Game Development, Web Development, and Interaction Design.
If you want to work with me, let me know!
R • Python • SPSS • Excel • Figma • Adobe Creative Suite • Lens Studio • Unity • Procreate • Blender • HTML • CSS • JS • Git
Visual Discovery Conference 2025 - Student Award
2024 Snap AR Lens Fest Awards - Finalist
2024 US Snap AR Lens Challenge - 3rd Place
Class Project – 2025
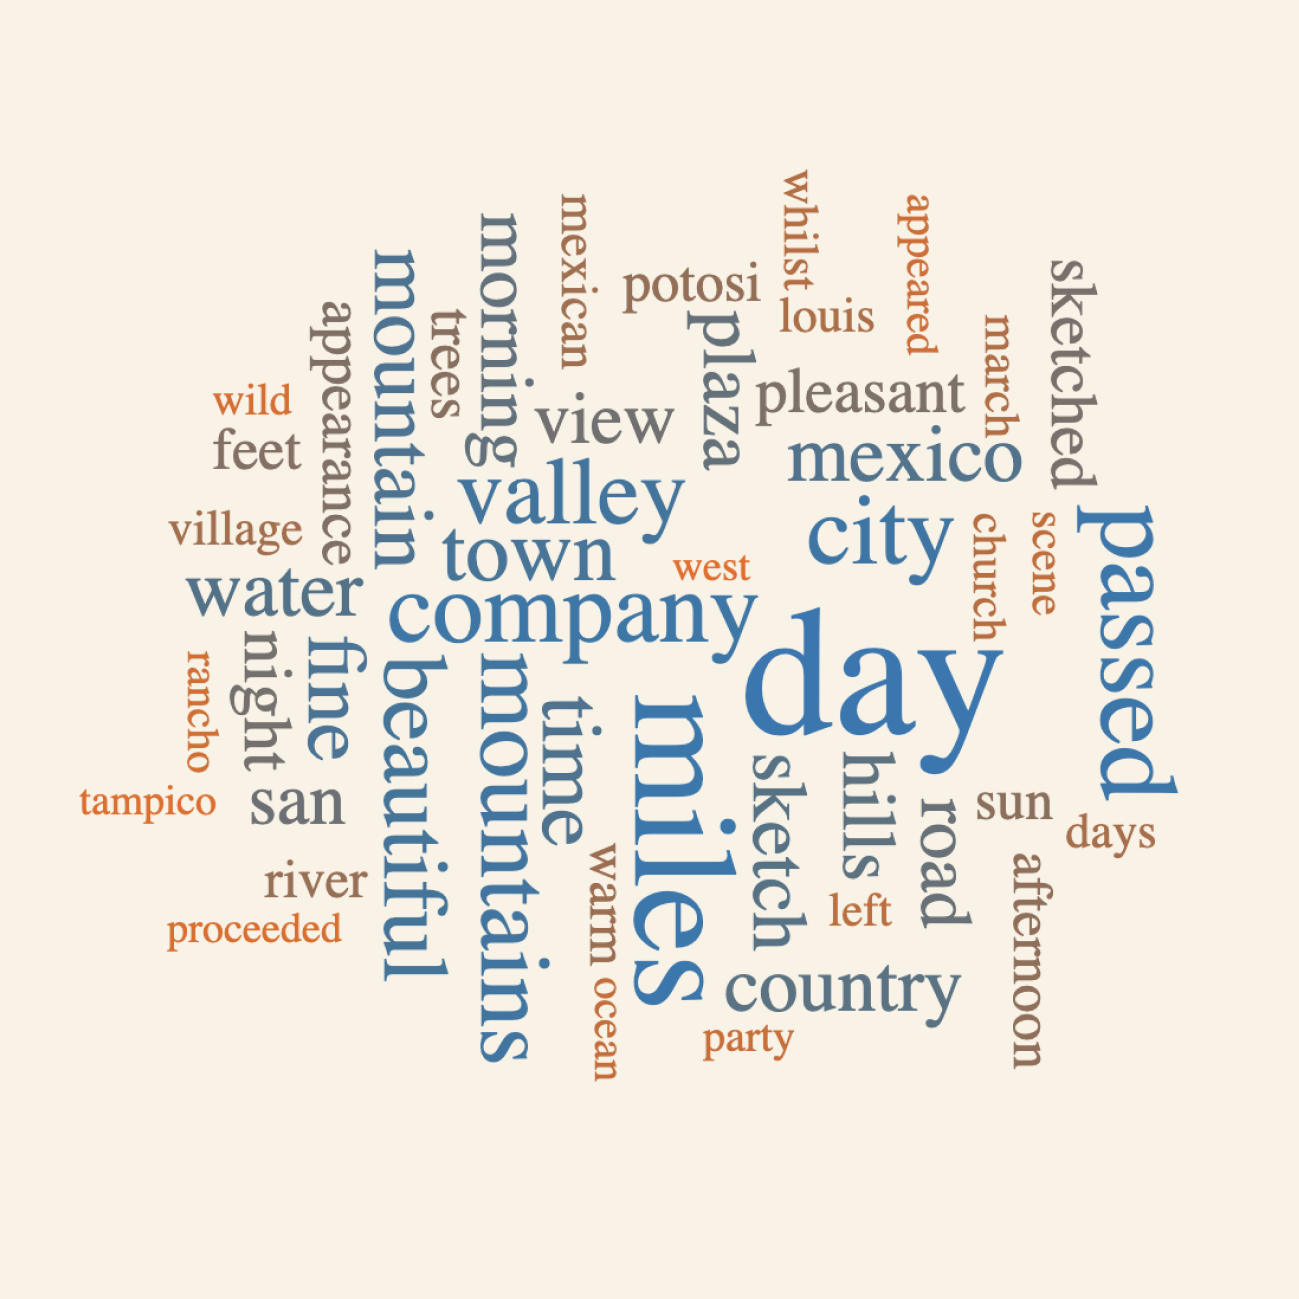
A historical timeline and text analysis of Benajah Jay Antrim’s written and visual journal aims to recognize his contribution to knowledge about Mexico’s socio historical, natural, and physical characteristics during the California gold rush. Made with ArcGIS StoryMaps, D3.js, and R. This project is one of the winners of the Student Poster Competition at the Visual Discovery Conference 2025.
SEE MORE
Class Project – 2025
By analyzing data from the South China Sea Data Initiative, these graphics reveal the density and clustering of China-related hostile incidents in the area compared to China’s nine-dash line claim and each ASEAN country's exclusive economic zone. Made with Adobe Illustrator, ArcGIS, and R.
SEE MORE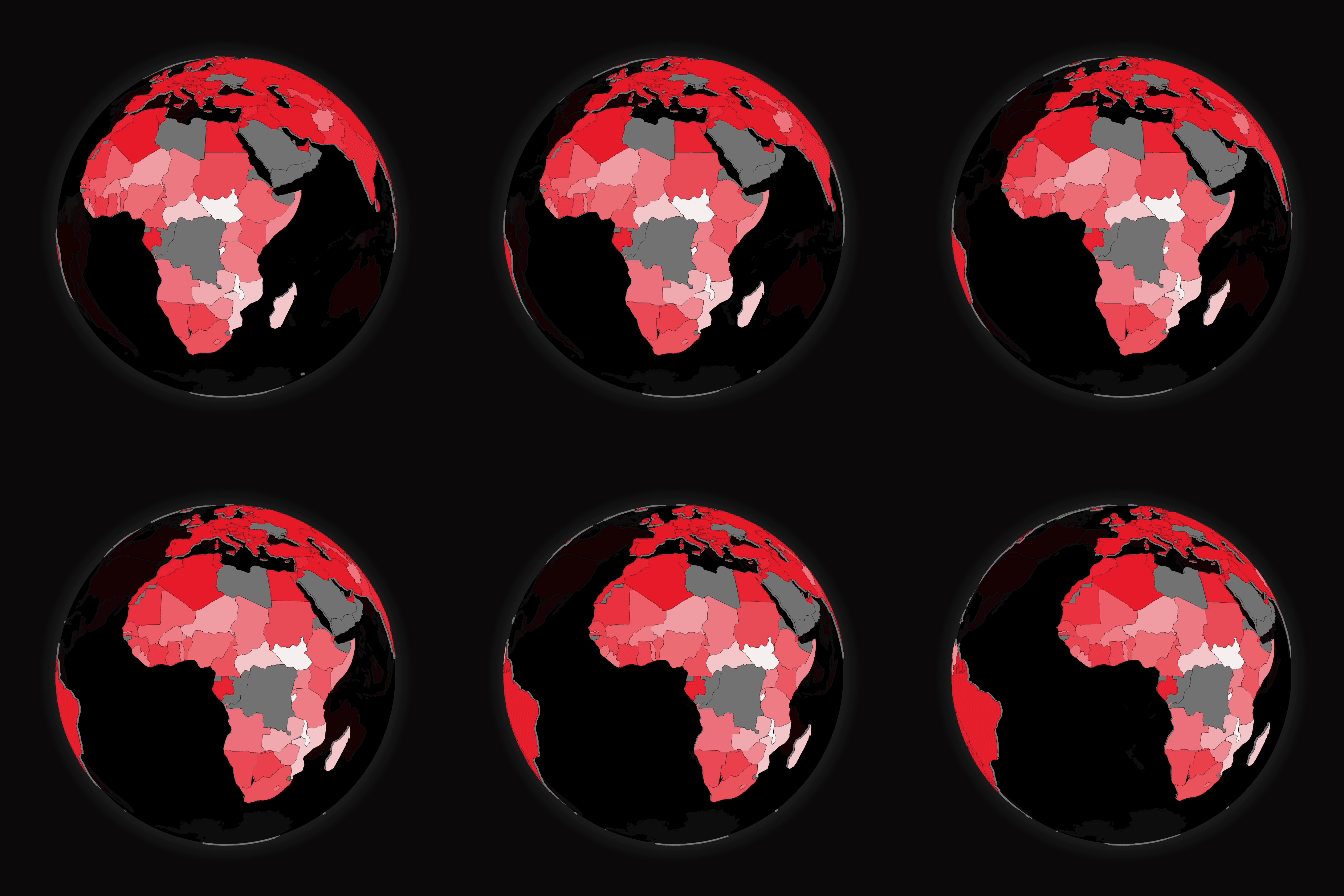
Class Project – 2025
The Sustainable Development Goals (SDG) Index Tracker uses a 3D globe choropleth map to track all countries' progress towards the SDG for each goal and by year. The United Nations calculates the index by aggregating various demographic measures of a specific country. Made with R and Globe.GL.
SEE MORE
Class Project – 2025
I explored the variation in VADER sentiment of Bluesky social media posts based on time, specifically, the time of day (Morning, Afternoon, Evening, Night) and weekday (Monday to Sunday). Using non-parametric statistical tests (Kruskal-Wallis and Wilcoxon), the results revealed significant differences in sentiment in the time of day group.
SEE MORE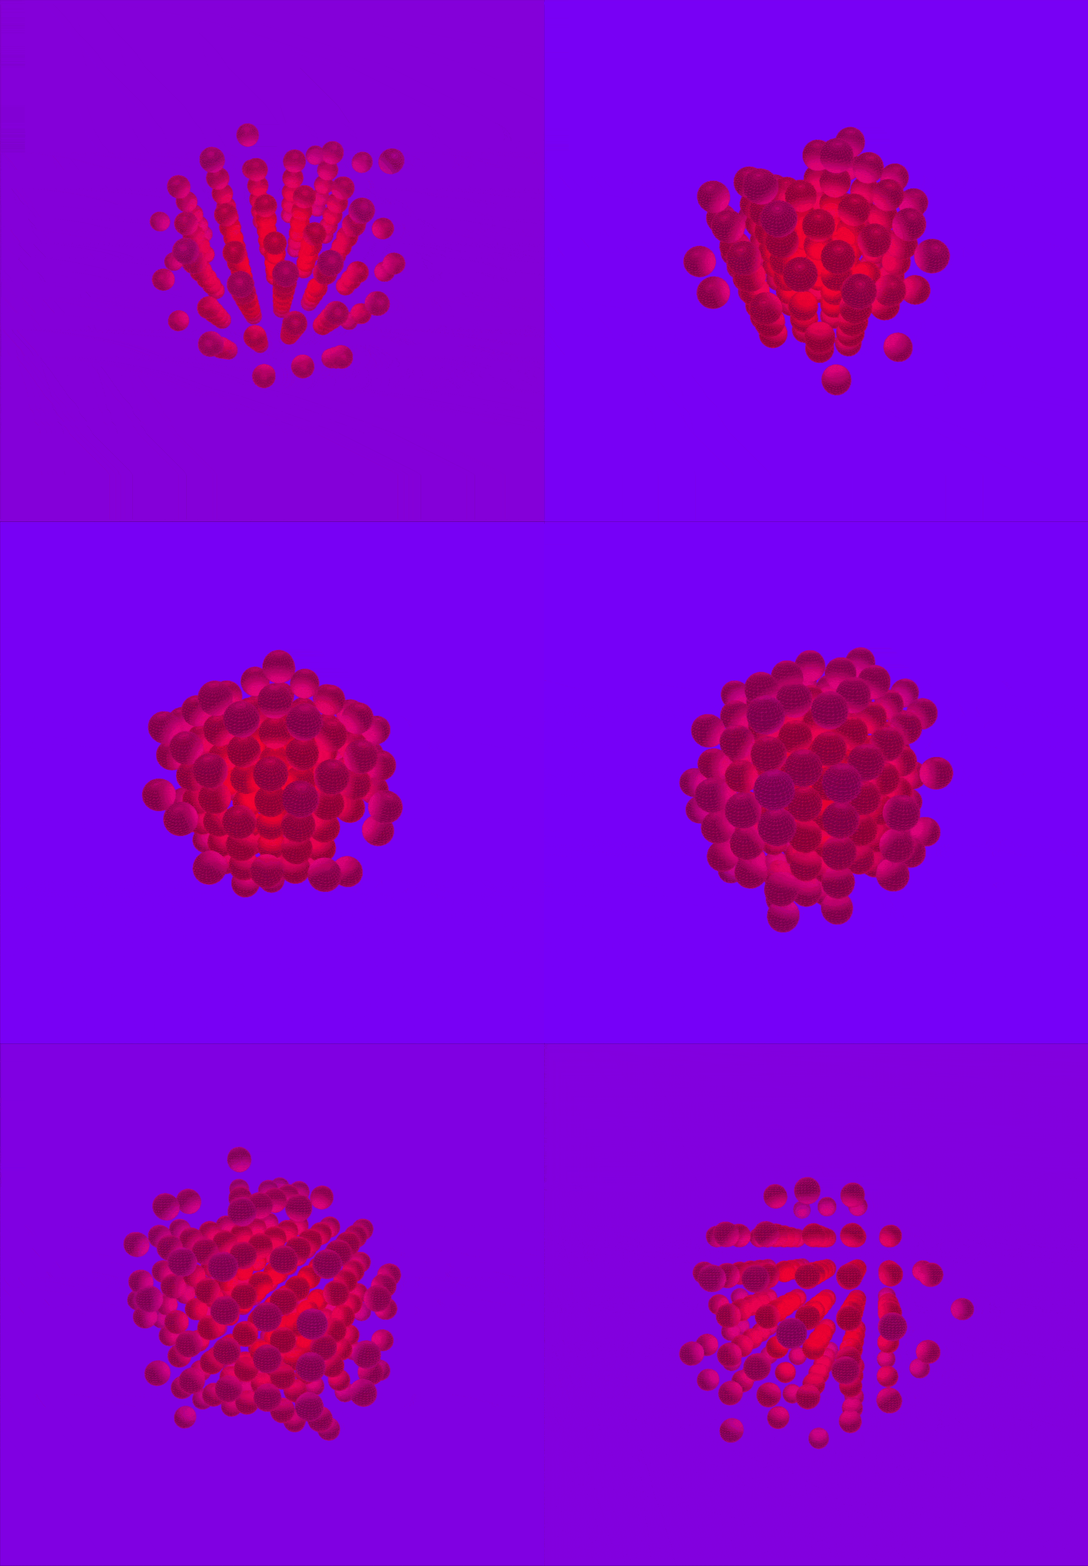
Class Project – 2025
Music Visualizer is a web application that uses the Fast Fourier transform function in p5.js to get the amplitude and frequency of an audio file. The visualization works by distinctly parameter mapping these values to the scale, background color, sphere color, and number of spheres in a 3D grid. Made with p5.js.
SEE MORE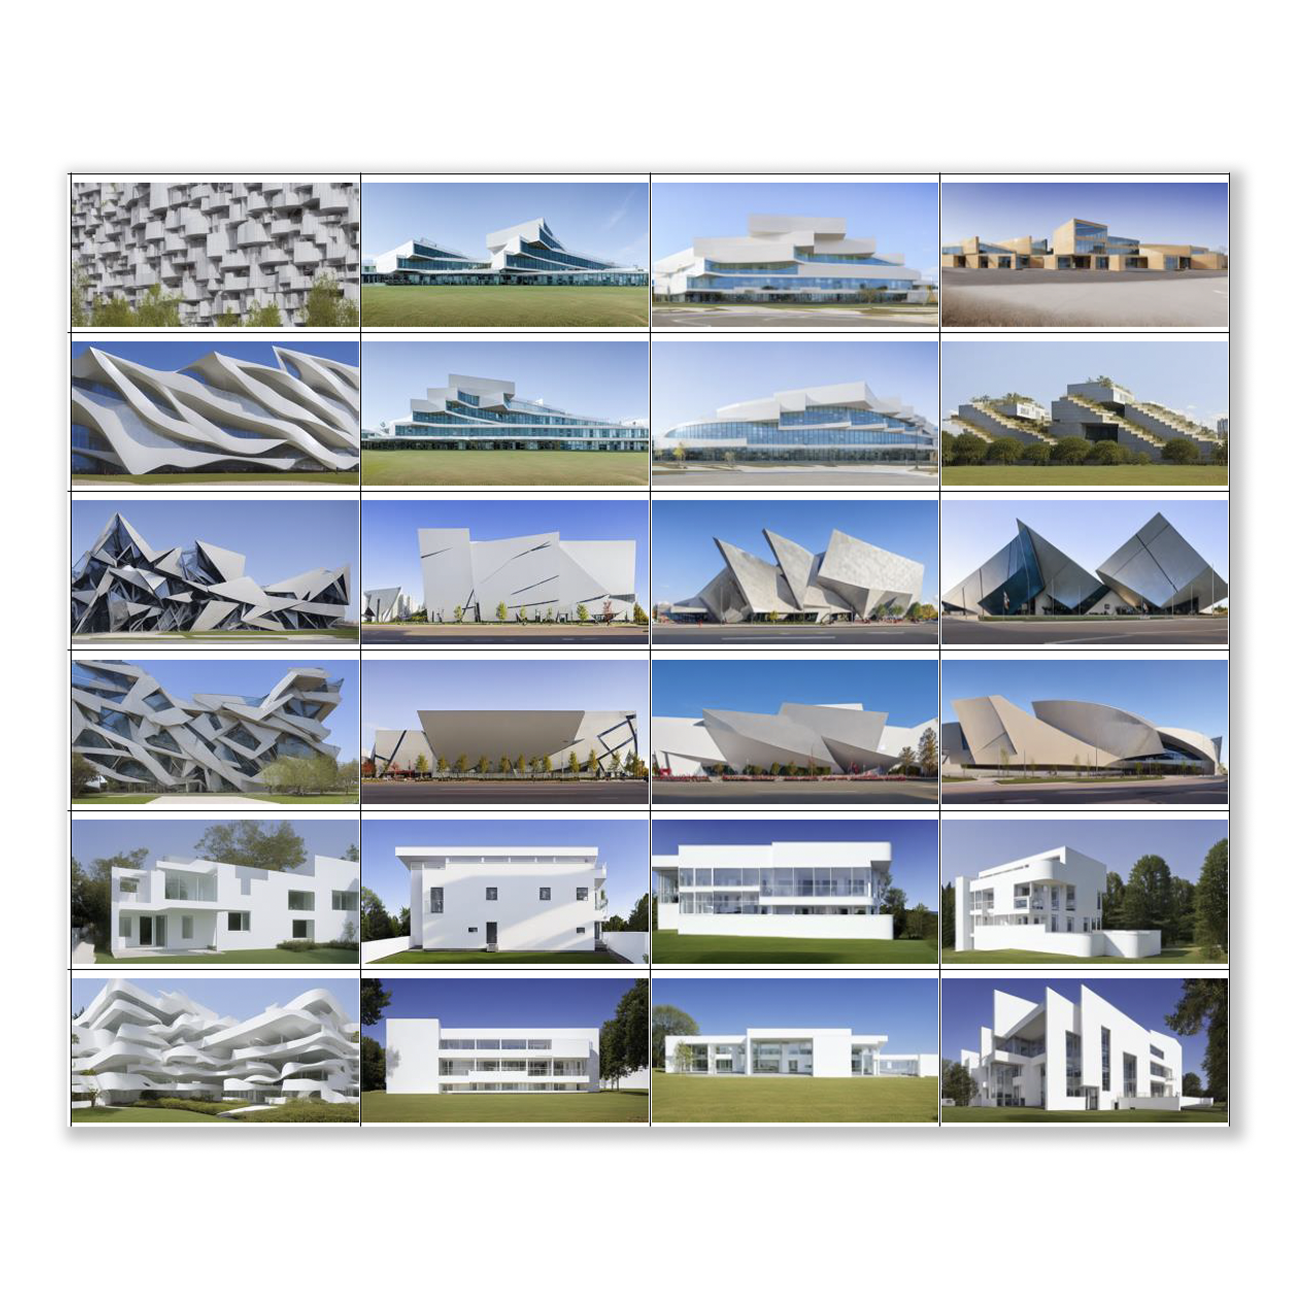
Yonsei Space & Design IT Lab – 2024
During my research internship at Yonsei University, Seoul, South Korea, I co-authored a research paper with a team of 7 about a new approach in preparing text-image data pairs used for training Stable Diffusion models to improve generated architectural visualization renderings. IEEE published the paper after acceptance at the 2024 IEEE MIT Undergraduate Research Technology Conference.
SEE MORE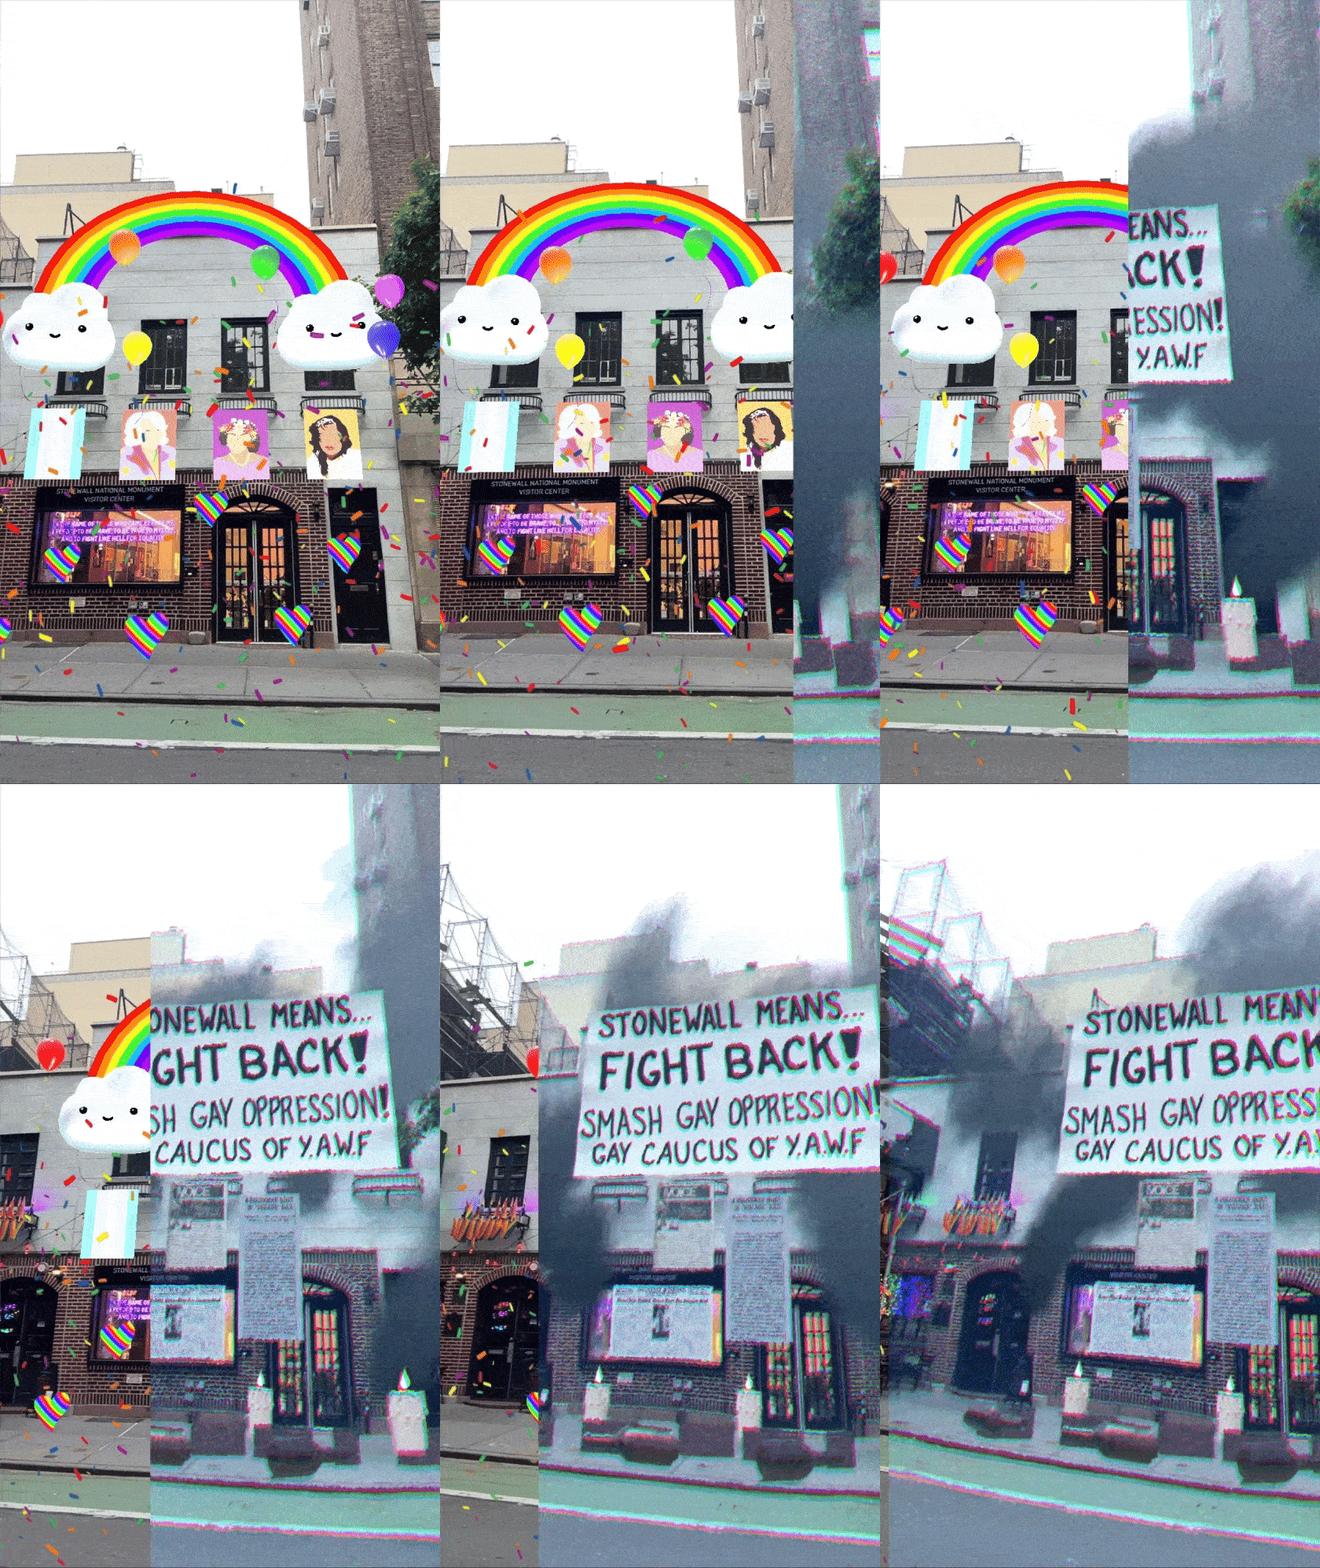
Snap Inc. – 2024
Views of Stonewall is a Custom Location AR lens focused on the heritage of the Stonewall Inn and the 1969 Stonewall Riots. Using AR as a medium of protest, the AR lens aims to uplift transgender women who face marginalization and erasure to this day. Snap Inc. selected it as a finalist for the Best Artistic Lens category of Snap AR’s 2024 Lens Fest Awards.
SEE MORE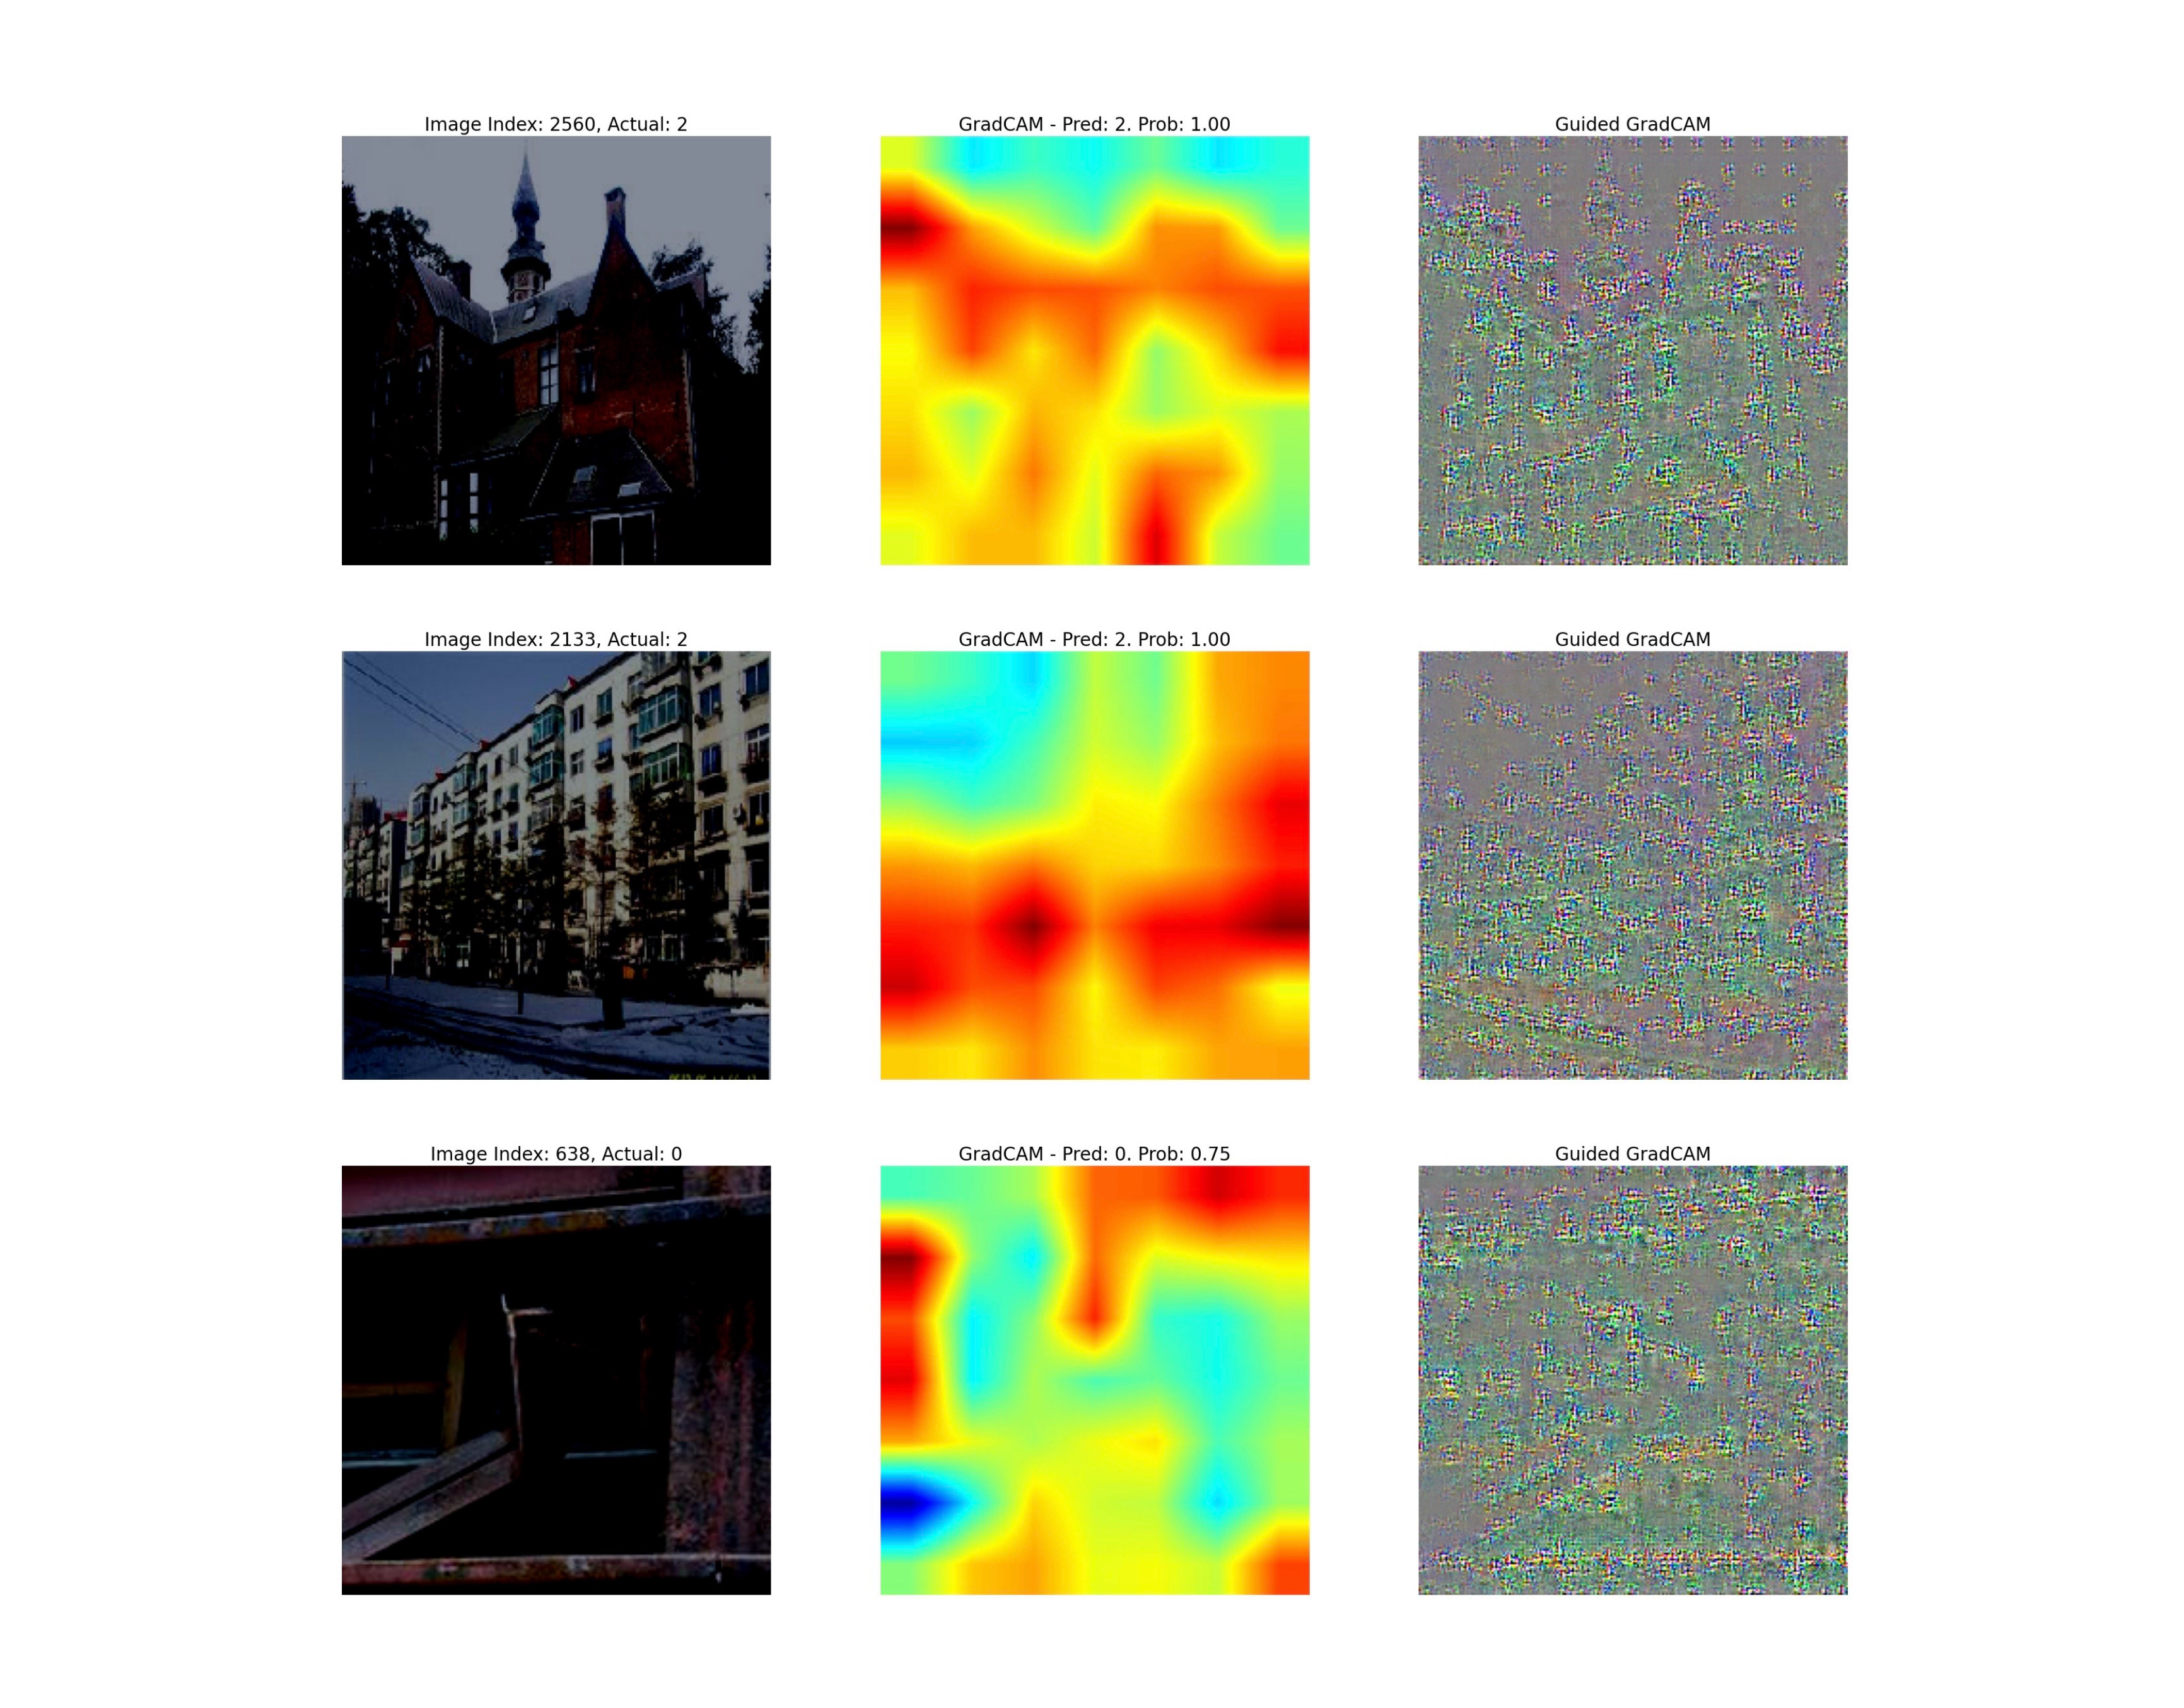
Class Project – 2024
I used CNNs to categorize building scene level images, achieving 86% test accuracy with a traditional CNN model and 93% with a transfer learning model after fine-tuning. The process included data augmentation, class weights, and callbacks for the model with GradCAM for result interpretability. Made with Python (Tensorflow).
SEE MORE